How Process Control Visualization Elevates Advanced Lighting Systems
Process control visualization is the digital nervous system that translates raw sensor data into intuitive, actionable displays. When paired with advanced lighting systems—those that can adapt wavelength, intensity, and distribution in real time—the result is a dynamic environment that optimizes energy use, enhances human performance, and meets stringent regulatory standards. This guide unpacks the technical foundations, integration pathways, and practical outcomes of marrying process control visualization with advanced lighting, offering a roadmap for engineers, facility managers, and decision‑makers seeking measurable benefits.
Understanding Process Control Visualization
At its core, process control visualization aggregates data streams from distributed sensors, applies analytical models, and presents the results on dashboards, HMI (Human‑Machine Interface) panels, or immersive displays. Key functions include:
Real‑time monitoring: Continuous capture of luminance, color temperature, power draw, and environmental variables.
Trend analysis: Historical data overlays reveal drift, wear, or seasonal patterns that inform maintenance schedules.
Alarm management: Threshold‑based alerts flag deviations that could compromise safety, compliance, or energy budgets.
Predictive insight: Machine‑learning algorithms forecast lighting demand, enabling pre‑emptive adjustments.
Visualization platforms range from lightweight web‑based panels to full‑scale SCADA (Supervisory Control and Data Acquisition) systems. The choice hinges on the scale of the lighting network, integration depth, and user expertise.
Core Components of Advanced Lighting Systems
Advanced lighting systems are far more than simple on/off fixtures. They comprise:
Smart drivers and ballasts: Provide granular control over voltage, current, and dimming curves.
Spectral tuning modules: Adjust wavelength output to match specific tasks—e.g., blue‑rich light for assembly line precision, warm amber for patient recovery rooms.
Networked communication layers: Ethernet, DALI, or fiber‑optic links relay commands and telemetry across the facility.
Embedded sensors: Photodiodes, color sensors, and occupancy detectors feed real‑time feedback into the control loop.
The modular nature of these components makes them ideal candidates for integration with a process control visualization layer, allowing each element to be monitored, configured, and optimized from a single interface.
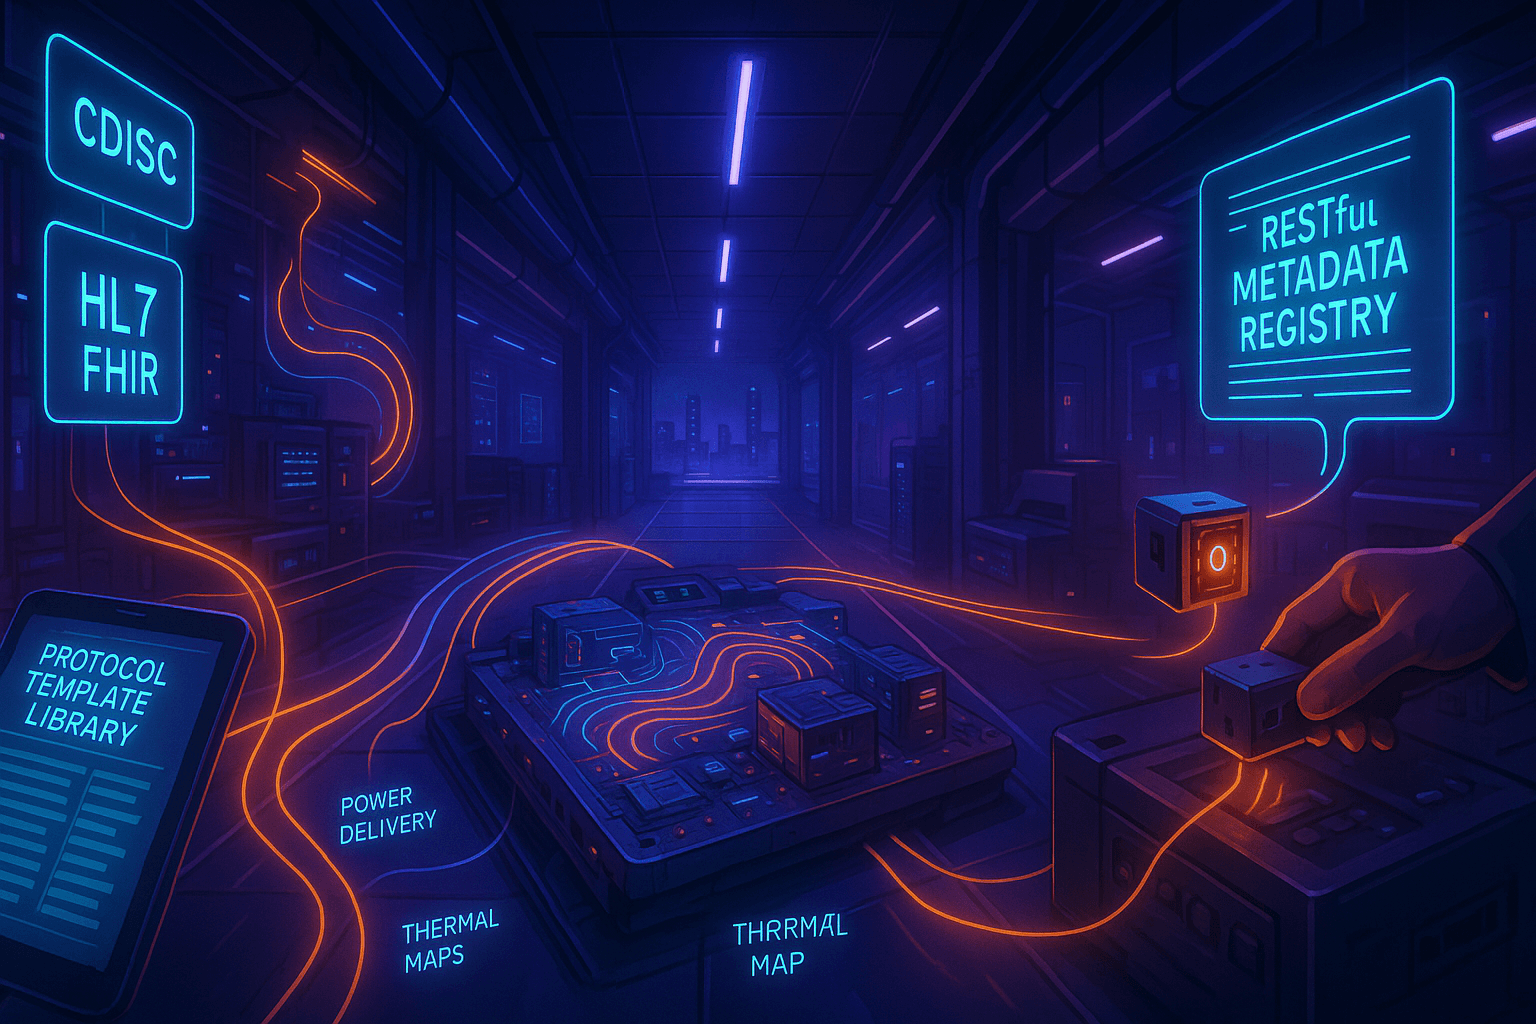
Integrating Visualization with Lighting Control
Successful integration follows a three‑tiered architecture:
Data acquisition tier: Sensors and smart fixtures transmit raw metrics via OPC-UA, MQTT, or proprietary protocols.
Analytics tier: Edge processors or cloud services cleanse, normalize, and enrich the data, applying algorithms for occupancy prediction, daylight harvesting, and fault detection.
Presentation tier: Dashboards render the processed information in graphs, heat maps, and control widgets, enabling operators to intervene or automate adjustments.
This separation of concerns ensures scalability; a single lighting zone can be expanded into a campus‑wide network without overhauling the underlying visualization stack.
Data Acquisition and Sensor Networks
Robust data acquisition begins with selecting the right sensor suite. Photometric sensors capture illuminance (lux), while spectrometers provide wavelength distribution. Occupancy sensors, often infrared or ultrasonic, add context for demand‑driven dimming. All sensors should support standardized interfaces—DALI‑2, Zigbee, or BACnet—so that the visualization layer can poll or subscribe to data without custom adapters.
Network reliability is paramount. Fiber‑optic backbones, as championed by Fiberoptic Systems, Inc. (FSI), deliver low‑latency, interference‑free transmission, especially in electrically noisy industrial environments. Redundant ring topologies further protect against single‑point failures, ensuring the visualization dashboard never loses critical telemetry.
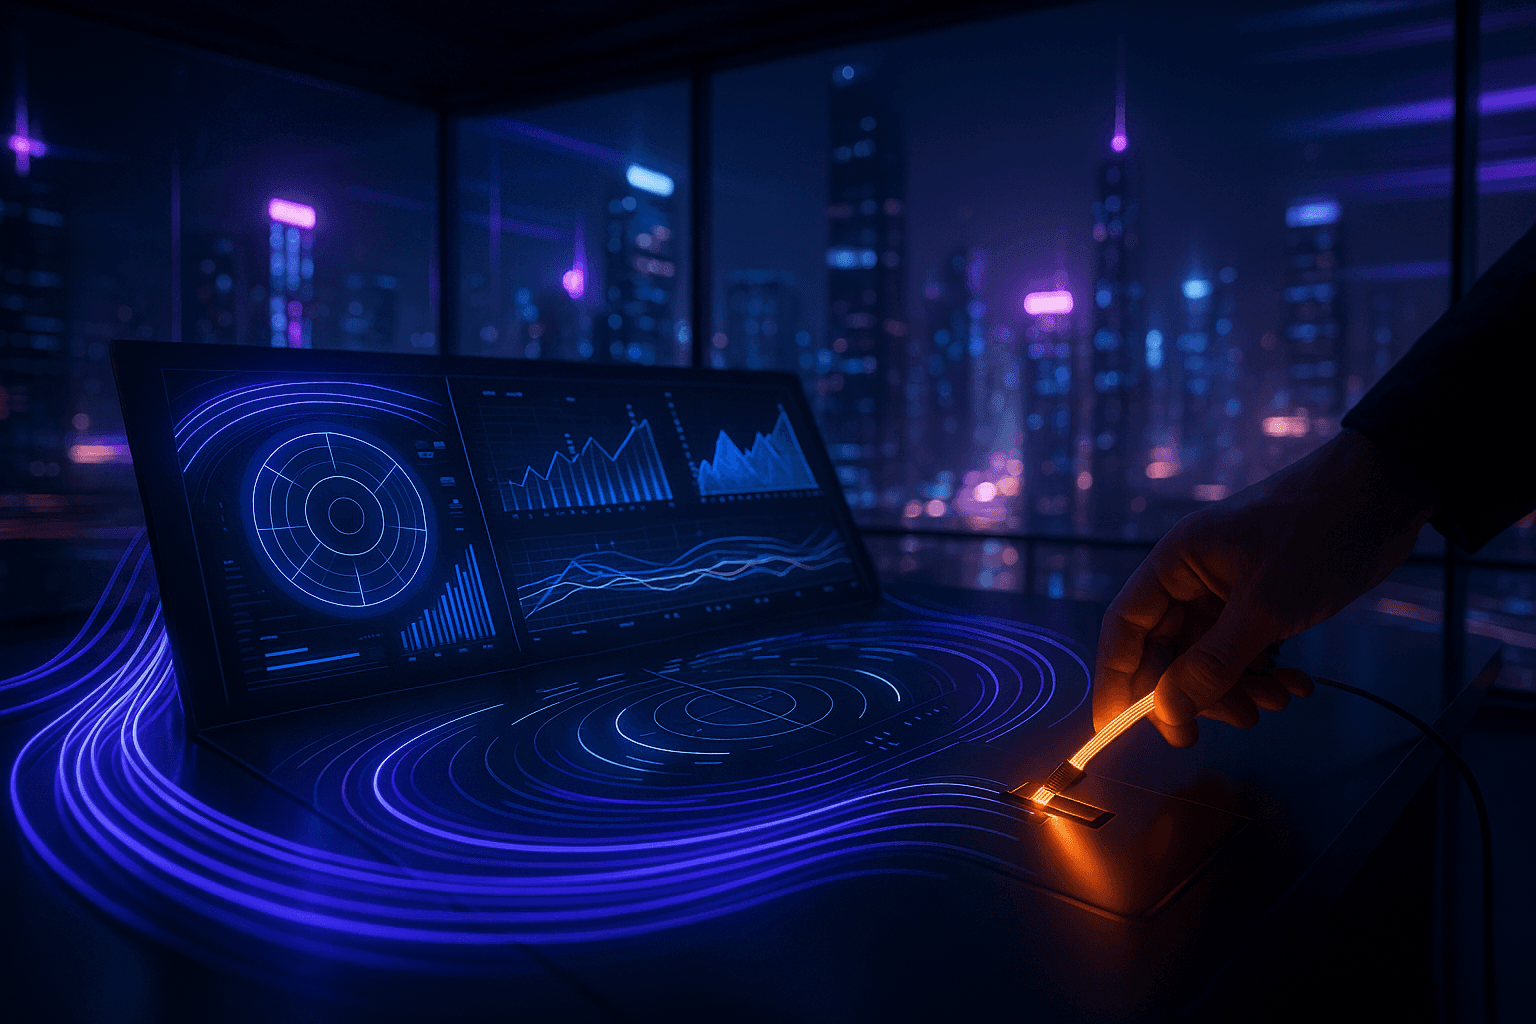
Visualization Platforms and Dashboards
When choosing a platform, consider the following criteria:
Scalability: Ability to render thousands of data points without latency.
Extensibility: Support for custom widgets—e.g., a “light‑trail” diagram that animates photon flow across a fiber‑optic link.
Security: Role‑based access controls and encrypted data streams to meet defense or healthcare compliance.
Interoperability: Native connectors for PLCs, DCS, and building management systems.
Modern platforms leverage HTML5 and WebGL, enabling browser‑based access on desktops, tablets, and even AR headsets. This flexibility empowers frontline technicians to visualize lighting performance at the point of service.
Human‑Machine Interface Design
An effective HMI balances detail with clarity. Best practices include:
Contextual grouping: Cluster related metrics—illuminance, power, and temperature—into collapsible panels.
Visual hierarchy: Use color coding (green for nominal, amber for warning, red for alarm) and size differentiation to guide attention.
Interactive drill‑down: Clicking a heat map cell should reveal the underlying sensor IDs, firmware versions, and recent event logs.
Predictive overlays: Forecasted lighting demand displayed as a translucent line helps operators anticipate load spikes.
Accessibility considerations—high‑contrast themes, keyboard navigation, and screen‑reader support—ensure that the visualization suite complies with ADA and ISO 9241‑210 standards.
Case Study Highlights
Real‑world deployments illustrate the tangible impact of process control visualization on advanced lighting systems.
Manufacturing Floor Lighting Optimization
A mid‑size electronics assembly plant integrated DALI‑enabled LED fixtures with an OPC-UA visual dashboard. By correlating line‑speed data with ambient light levels, the system automatically dimmed fixtures during low‑intensity tasks, cutting lighting energy consumption by 23 % while maintaining defect‑free rates. The dashboard’s alarm matrix highlighted any fixture deviating from calibrated spectra, prompting rapid replacement before quality issues emerged.
Healthcare Facility Light Management
A regional hospital adopted a daylight‑harvesting solution that blended natural light sensors with tunable white LEDs. Process control visualization displayed patient‑room illuminance in real time, ensuring compliance with Joint Commission lighting standards. Predictive analytics adjusted light temperature throughout the day to support circadian rhythms, leading to a 15 % reduction in patient medication for sleep disturbances and a measurable boost in staff satisfaction scores.
Data‑Center Energy‑Efficient Illumination
In a Tier‑IV data center, fiber‑optic links carried both power‑over‑Ethernet and lighting control signals. Visualization software mapped illumination zones to server rack heat maps, revealing that over‑lit aisles contributed to localized hotspots. By dynamically dimming non‑critical zones during off‑peak hours, the facility achieved a 12 % reduction in auxiliary power usage effectiveness (APUE) without compromising safety.
Best Practices and Implementation Roadmap
Adopting process control visualization for advanced lighting requires disciplined planning. Below is a condensed roadmap that balances technical rigor with organizational readiness.
Step‑by‑Step Deployment
Stakeholder alignment: Convene facilities, IT, and safety teams to define objectives (energy savings, compliance, user comfort).
Audit existing infrastructure: Catalog all lighting fixtures, drivers, and sensor capabilities; note communication protocols.
Define data model: Standardize metric names, units, and timestamp granularity to ensure consistent visualization.
Pilot implementation: Select a representative zone (e.g., a single production line) for end‑to‑end integration.
Iterative refinement: Use pilot feedback to adjust alarm thresholds, dashboard layouts, and control algorithms.
Scale out: Replicate the validated architecture across additional zones, leveraging fiber‑optic backbones for bandwidth.
Continuous improvement: Schedule quarterly reviews of KPI trends, update firmware, and incorporate emerging analytics.
Performance Metrics and KPI Tracking
Quantifying success ensures the investment delivers ROI. Core KPIs include:
Lighting Energy Intensity (LEI): kWh per square foot, normalized for occupancy.
Spectral Fidelity Index (SFI): Percentage deviation from target wavelength distribution.
Mean Time to Detect (MTTD): Average interval between fault occurrence and alarm acknowledgment.
User Comfort Score (UCS): Survey‑derived rating correlated with illuminance consistency.
Visualization dashboards should surface these KPIs alongside raw sensor data, enabling rapid root‑cause analysis and data‑driven decision making.
Why Fiberoptic Systems Leads the Field
Fiberoptic Systems, Inc. (FSI) brings over four decades of in‑house fiber drawing expertise to the nexus of process control visualization and advanced lighting. By delivering ultra‑low‑latency, interference‑immune fiber links, FSI empowers facilities to gather high‑resolution lighting telemetry at scale, while its custom‑engineered connectors simplify integration with DALI, OPC-UA, and Ethernet‑based platforms. Coupled with a culture of relentless quality and a portfolio of end‑to‑end solutions, FSI stands as a strategic partner for organizations seeking to turn sophisticated lighting networks into measurable, visualized performance assets.